Project Description
Chapter 6
Dashboarding Analytics
The IBM Carbon Design System has been instrumental in addressing the lack of dashboarding and analytics. Known for its robust suite of tools, Carbon enables teams to:
- Integrate well-defined design and development standards, crucial for efficiently presenting complex data.
- Facilitate a quick grasp of application functionalities derive meaningful insights, with the use of graphs and charts.
Data visualization for Worklists
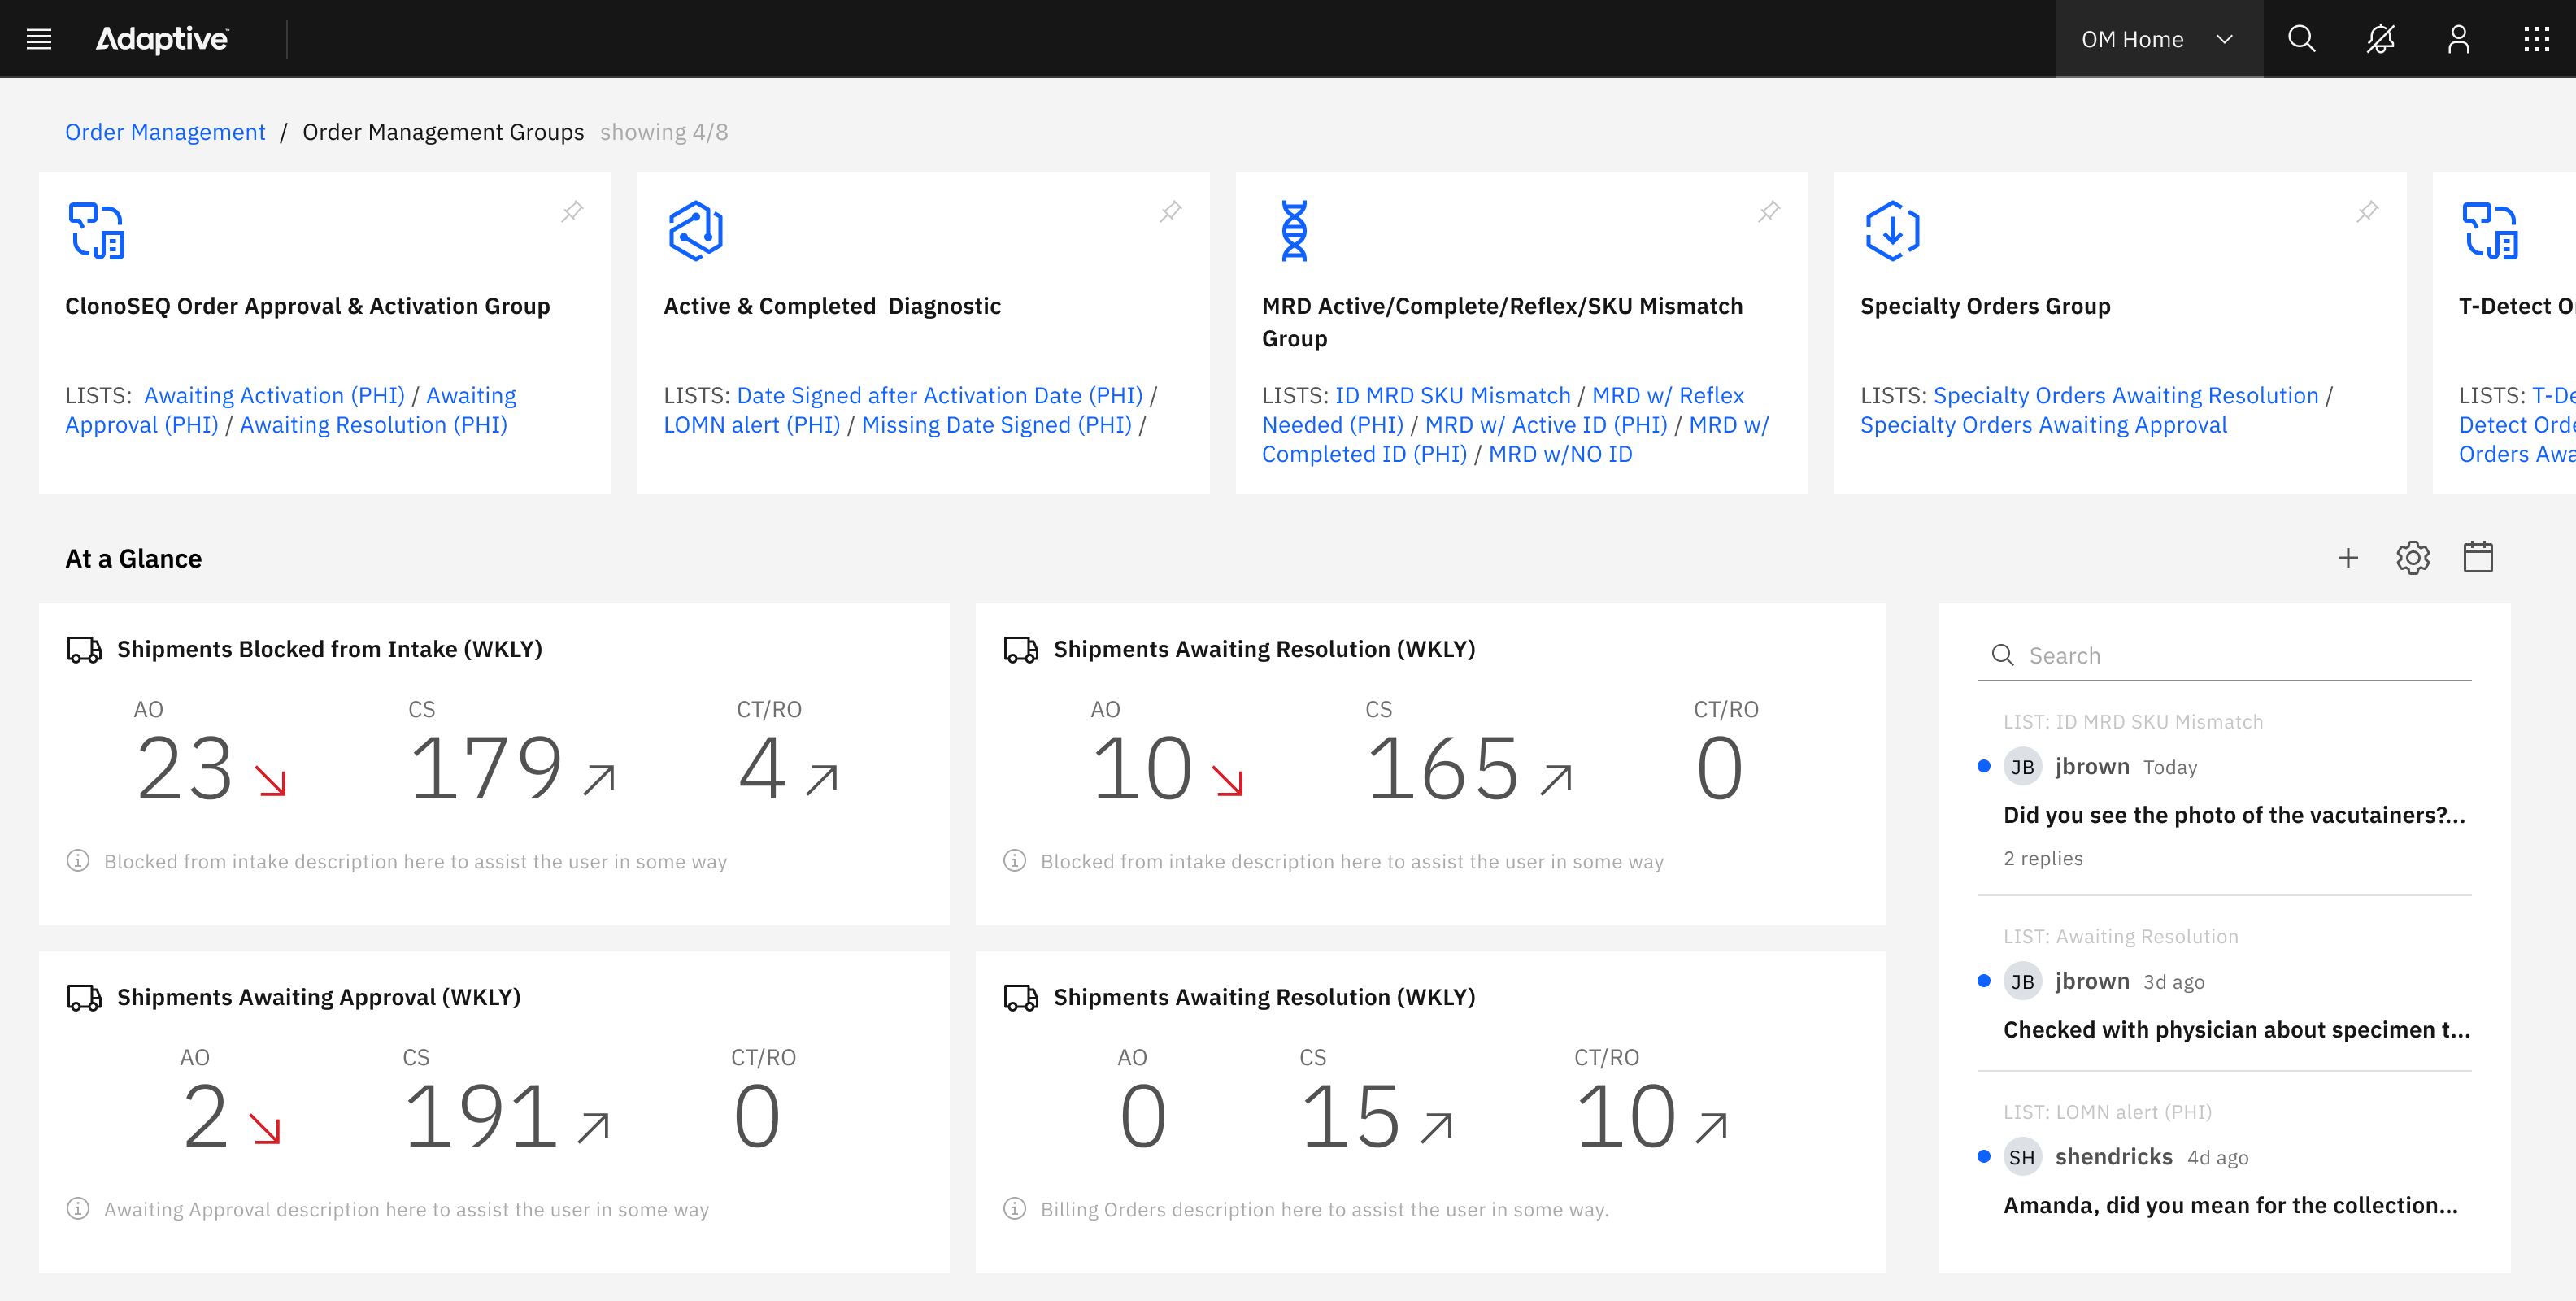
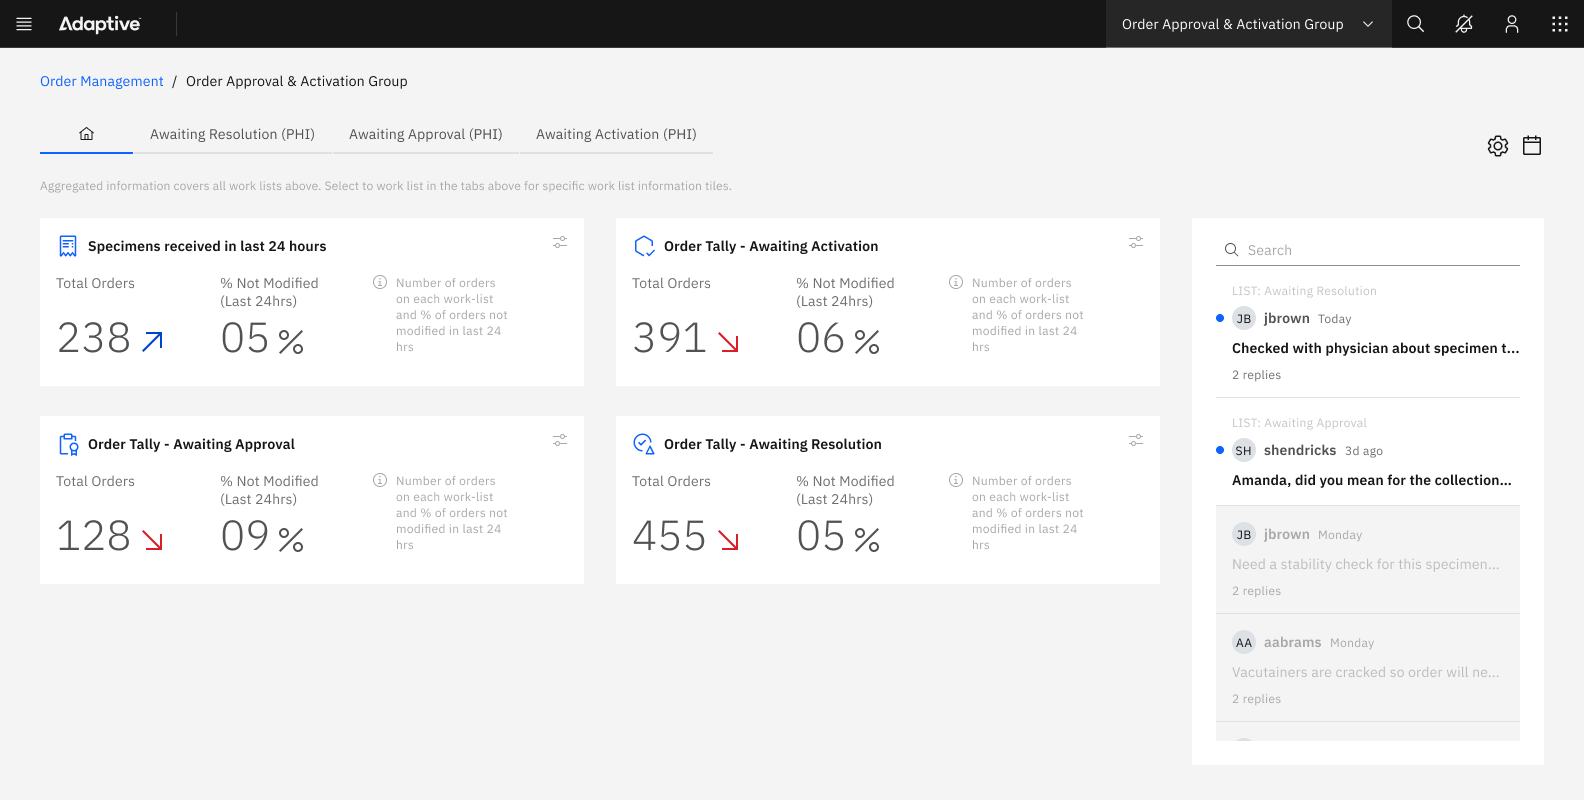
During the initial phases of the project, the UX team undertook a design exercise focused on providing deep insights into the multifaceted layers of business operations. We introduced “insight tiles,” which employed a revised information architectural schema. This design was intended to address the various states of Workflows for clinical diagnostics, batch research orders, and their readiness, along with flagged alerts or discrepancies.
These workflows were categorized within different worklists, each queryable for unique purposes along the journey, such as:
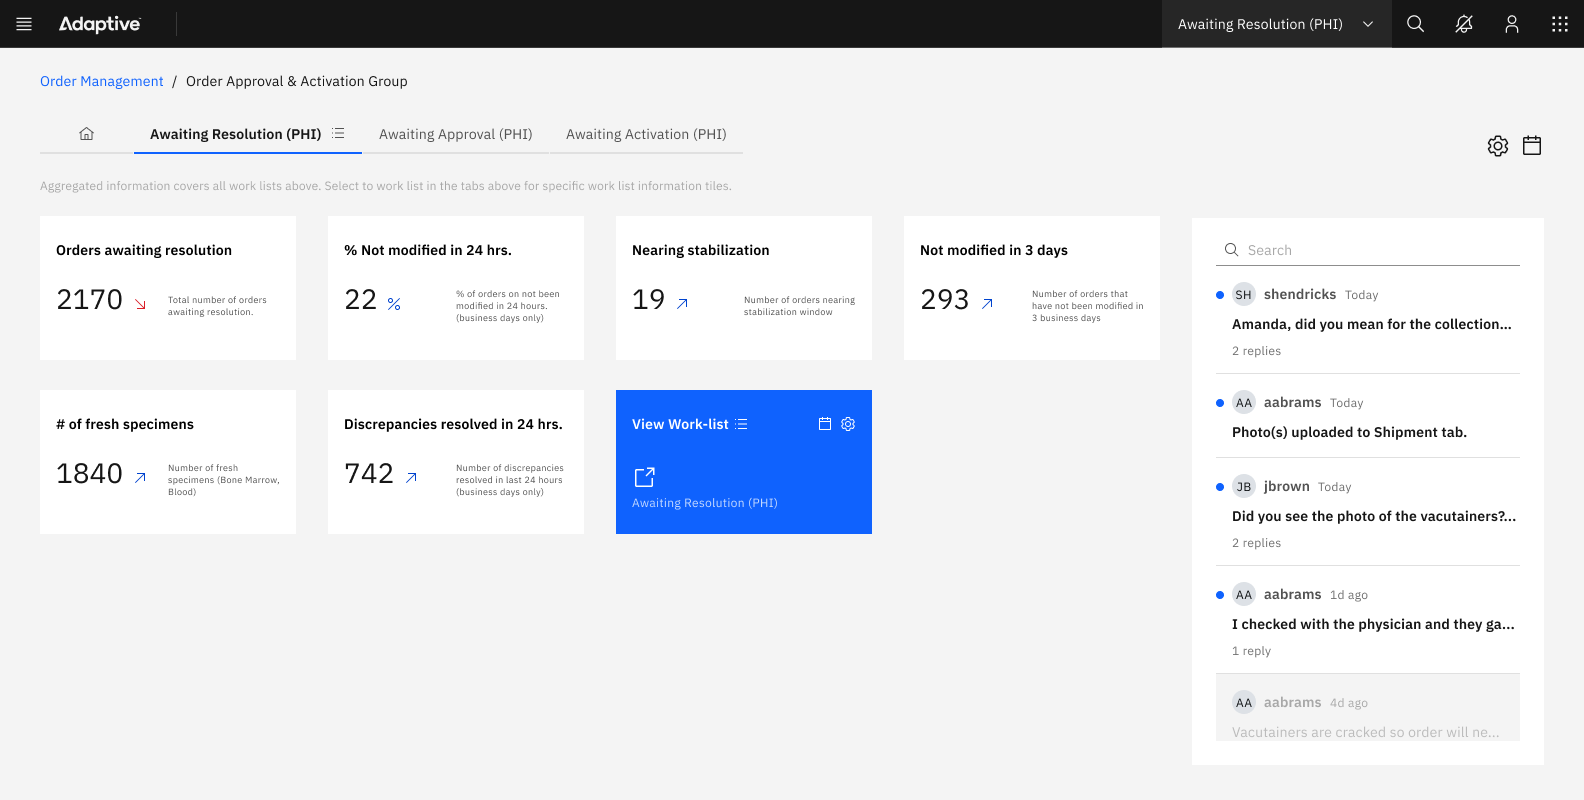
- Total number of orders awaiting resolution
- Percentage of orders on the worklist unmodified in the last 24 hours
- Number of orders nearing stabilization
- Number of orders potentially unmodified in 3 days
- Number of MRD-enabled patient orders
- Number of fresh specimens (e.g., bone marrow, blood)
From a UX journey perspective, the system was designed to offer users multiple levels of insight as they begin their workday, helping them either commence new tasks or continue from where they left off.
This is particularly useful in laboratory settings where sample processing occurs overnight, and data such as assignments and numbers may shift significantly.
Future improvements: Smart Tiles
Looking ahead, the UX team is exploring the potential of “smart tiles.”
This innovative concept would allow users of the order management system to perform custom queries against specific views, providing even deeper and more nuanced insights into the orders and clinical trials data. Users would be able to create smart tiles based on specific columns of interest within the custom queries, with the added functionality of saving and sharing these custom views. This capability would offer enhanced reporting tools for leadership, facilitating better decision-making and strategic planning.


